GEO Agency ROI Calculator: 12 Metrics We Track for Client Success
Design

Tanuj Sarva
03/05/2026

How do leading GEO agencies measure real client success in 2026? Web of Picasso tracks 12 comprehensive metrics across visibility, business impact, and competitive positioning that connect generative engine optimization directly to revenue. These metrics prove ROI by measuring citation frequency, AI-attributed pipeline, conversion quality, and share of voice rather than vanity KPIs that look impressive but don't drive business results. For businesses looking to optimize their digital strategies, we discuss comprehensive metrics for GEO impact that lead to substantial ROI.
Why Traditional SEO Metrics Fail for Generative Engine Optimization
Most agencies measuring GEO success use adapted SEO metrics that completely miss how AI platforms actually create business value. Rankings, click-through rates, and organic traffic don't capture the zero-click awareness building, brand authority establishment, and pre-qualification that make generative engine citations valuable.
According to Gartner's 2026 research, 60%+ of AI platform interactions end without clicks. Traditional analytics showing zero value for these interactions dramatically understate GEO impact and lead companies to underinvest in their highest-ROI channel.
At Web of Picasso, I've spent 5+ years refining measurement frameworks that capture true GEO business value. The agencies claiming success while measuring only traffic volume miss the awareness, authority, and pipeline influence that AI citations create before prospects ever visit websites.
The Three-Layer Measurement Framework
Effective GEO measurement requires tracking metrics across three distinct layers: visibility, quality, and business impact. Agencies jumping straight to impact metrics without establishing visibility baselines create attribution gaps they can't explain to clients.
Layer 1 - Visibility Metrics: How often and where your brand appears in AI-generated responses. These foundational metrics prove AI platforms recognize your authority and include you in relevant conversations.
Layer 2 - Quality Metrics: How your brand is portrayed, the context of citations, and sentiment of mentions. Visibility without quality creates negative impressions that damage rather than build brand value.
Layer 3 - Business Impact Metrics: Pipeline, revenue, and conversion outcomes directly traceable to generative engine visibility. These metrics connect optimization work to business results executives care about.
The 12 Metrics Web of Picasso Tracks for Every Client
Metric 1: Brand Visibility Score (Citation Frequency)
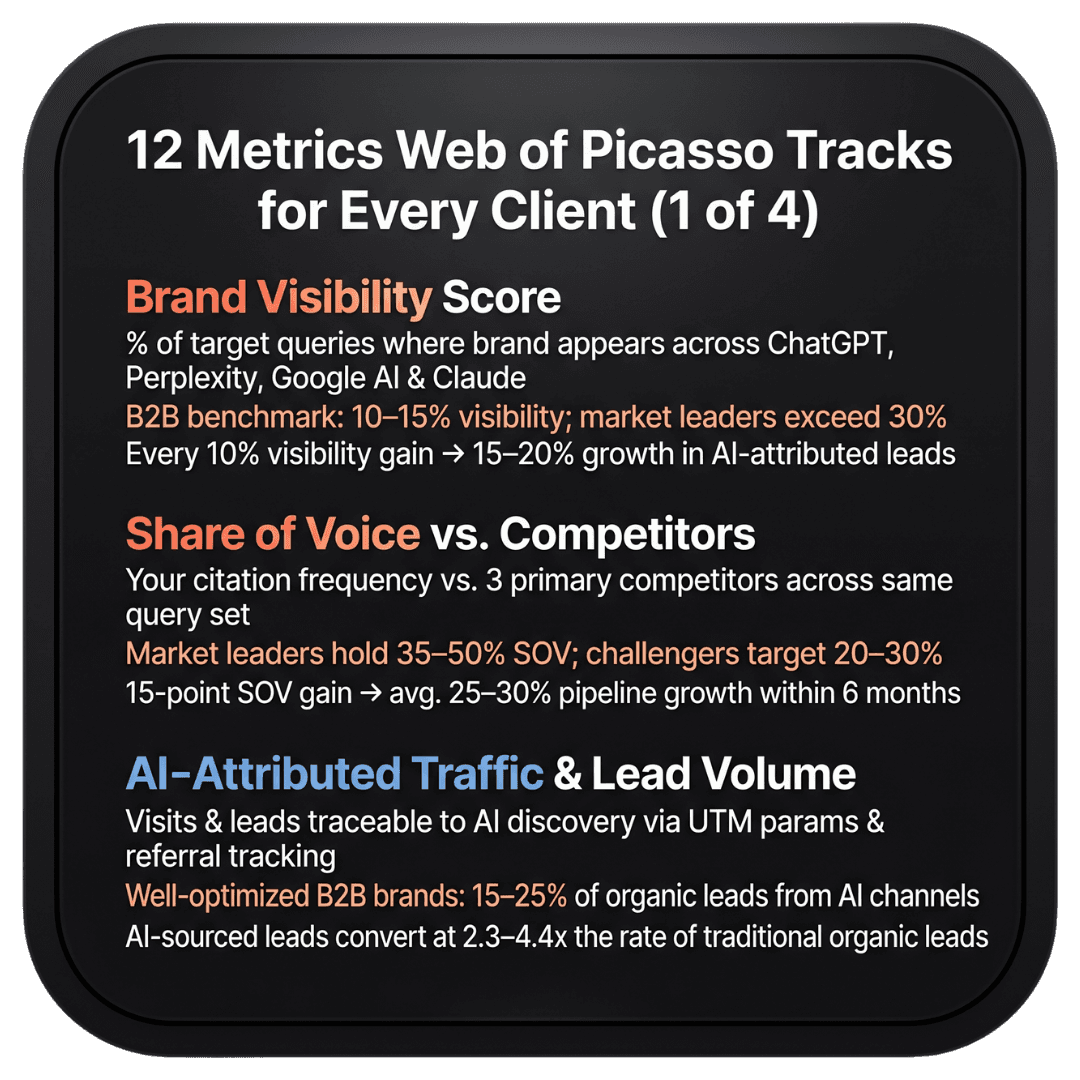
What It Measures: The percentage of target queries where your brand appears in AI-generated responses across ChatGPT, Perplexity, Google AI Overviews, and Claude. This is your fundamental presence indicator showing whether AI platforms recognize your authority.
Why It Matters: You can't influence prospects if AI platforms don't mention you. Visibility score provides baseline understanding of citation coverage before optimizing for quality or conversion.
What Good Looks Like: Healthy B2B brands achieve 10-15% visibility across relevant category queries. Market leaders typically exceed 30% visibility, meaning they appear in nearly one-third of prospect AI searches.
How We Track It: Our proprietary dashboard tests 100-500 target queries weekly across major platforms, documenting brand mention frequency with trend analysis showing improvement velocity. We segment by query type (awareness, consideration, decision) to understand funnel-stage coverage.
Business Connection: Higher visibility scores correlate directly with brand awareness improvements measured through direct traffic growth and branded search volume increases. Each 10% visibility improvement typically drives 15-20% growth in AI-attributed leads.
Metric 2: Share of Voice vs. Primary Competitors
What It Measures: Your citation frequency compared to three primary competitors across the same query set. This relative metric shows whether you're winning or losing AI-driven discovery battles that determine market share.
Why It Matters: Absolute citation frequency means little without competitive context. Appearing in 20% of queries sounds impressive until you discover competitors appear in 45%, capturing most prospect attention before your brand enters consideration.
What Good Looks Like: Market leaders maintain 35-50% share of voice, meaning they capture more citations than any competitor. Emerging challengers target 20-30% share of voice, while market followers typically sit below 15%.
How We Track It: Side-by-side competitive analysis showing your brand mention frequency versus three primary competitors across 200+ category-defining queries. Weekly reporting highlights share shifts requiring strategic response.
Business Connection: Share of voice improvements correlate strongly with market share growth. Web of Picasso clients increasing share of voice by 15 percentage points report average 25-30% pipeline growth from AI-attributed sources within six months.
Metric 3: AI-Attributed Traffic & Lead Volume
What It Measures: Website visitors and leads directly traceable to AI platform discovery through UTM parameters, referral tracking, and sales qualification questions identifying initial discovery method.
Why It Matters: This metric connects visibility directly to business outcomes, proving that AI citations drive actual prospects to your website rather than just building awareness that never converts.
What Good Looks Like: Well-optimized B2B brands generate 15-25% of total organic leads through AI-attributed channels by late 2026. Early-stage implementations start at 3-5% and grow 3-5 percentage points quarterly.
How We Track It: UTM parameters on all citations where AI platforms provide links, referral source analysis in Google Analytics, and sales process questions capturing discovery method. Monthly reports show AI-attributed lead volume with quarter-over-quarter growth rates.
Business Connection: AI-attributed leads convert at 2.3-4.4x the rate of traditional organic leads according to HubSpot's 2026 research, making each AI-sourced lead worth substantially more than traditional traffic.
Metric 4: Citation Quality & Context Score
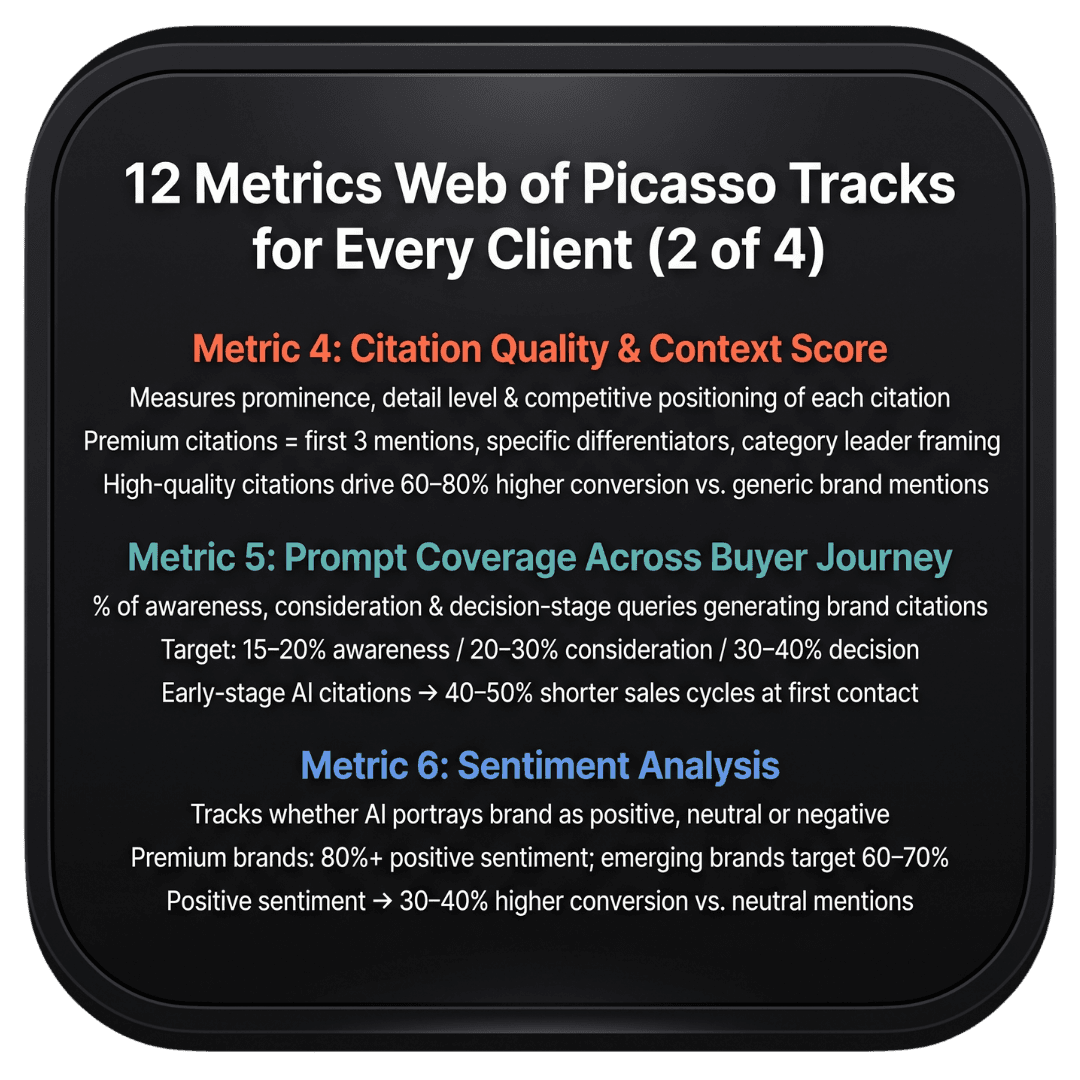
What It Measures: How your brand is described when cited - the surrounding context, positioning relative to competitors, prominence in the response, and accuracy of information AI platforms share about your solutions.
Why It Matters: Not all citations create equal value. Being mentioned last in a list of ten alternatives with generic description generates far less impact than appearing first with detailed explanation of unique differentiators.
What Good Looks Like: Premium citations include your brand in the first three mentions, provide specific detail about solutions, highlight competitive advantages, and position you as category leader rather than commodity alternative.
How We Track It: Qualitative analysis of 50 sample citations monthly, scoring prominence (1-5), detail level (1-5), competitive positioning (1-5), and accuracy (1-5). Aggregate scores show whether citation quality improves as volume increases.
Business Connection: High-quality citations drive 60-80% higher conversion rates than low-quality mentions. Prospects arriving with detailed understanding of your differentiation close faster and at higher rates than those seeing only generic brand mentions.
Metric 5: Prompt Coverage Across Buyer Journey Stages
What It Measures: What percentage of awareness, consideration, and decision-stage queries generate brand citations. This reveals whether you're captured early buyer journey research or only appearing when prospects compare final alternatives.
Why It Matters: Brands appearing only in decision-stage queries miss opportunities to shape consideration criteria and build preference before prospects narrow shortlists. Early-stage visibility influences which alternatives prospects evaluate later.
What Good Looks Like: Balanced coverage shows 15-20% visibility in awareness queries, 20-30% in consideration queries, and 30-40% in decision queries. This balance ensures influence throughout entire buyer journey rather than just final comparison.
How We Track It: Query categorization mapping each target search to buyer journey stage. Dashboard shows coverage percentage by stage with gap analysis identifying where optimization should focus.
Business Connection: Prospects discovering your brand through early-stage AI citations demonstrate 40-50% shorter sales cycles because they've already researched extensively before making contact, arriving further along their decision process.
Metric 6: Sentiment Analysis (Positive, Neutral, Negative)
What It Measures: Whether AI platforms portray your brand positively, neutrally, or negatively in generated responses. This qualitative metric identifies reputation issues requiring attention before they damage market perception.
Why It Matters: High citation frequency with negative sentiment actively damages your brand. AI platforms citing your company while highlighting problems, limitations, or customer complaints creates worse outcomes than no mentions at all.
What Good Looks Like: Premium brands maintain 80%+ positive sentiment with minimal negative mentions. Emerging brands target 60-70% positive sentiment while building authority that improves perception over time.
How We Track It: Manual sentiment analysis of 100 citation samples monthly, categorizing each as positive, neutral, or negative with specific quotes highlighting concerns. Trend analysis shows whether sentiment improves as optimization progresses.
Business Connection: Positive sentiment correlates with 30-40% higher conversion rates compared to neutral mentions. Negative sentiment actively reduces conversion below baseline, making reputation management critical for GEO success.
Metric 7: Pipeline Contribution & Revenue Attribution
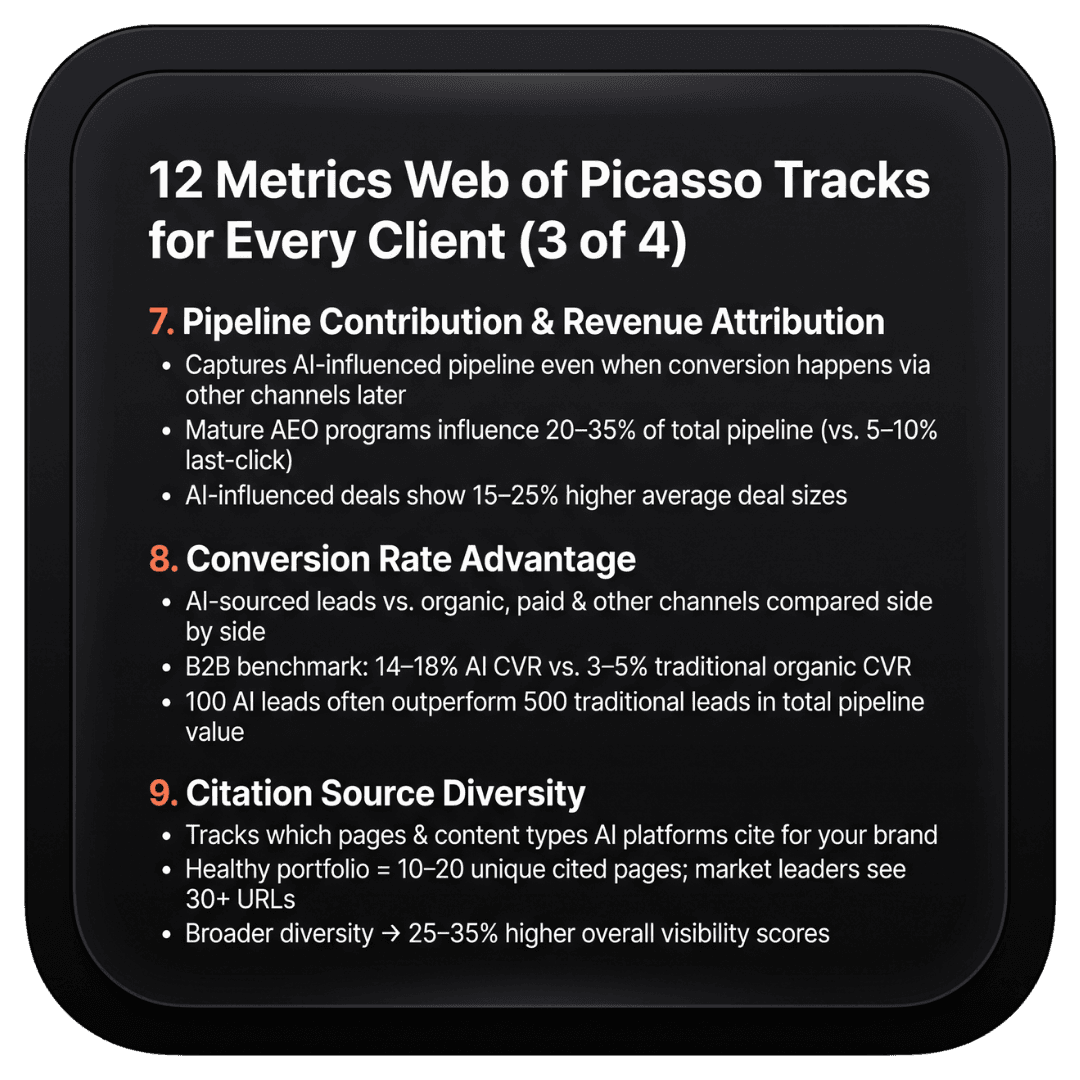
What It Measures: Opportunities and closed revenue directly influenced by generative engine visibility, even when initial discovery happens through AI platforms but conversion occurs through other channels later.
Why It Matters: This comprehensive attribution captures true business value rather than just last-click conversions. Many prospects discover brands through AI citations but convert weeks later through other touchpoints that traditional analytics credits incorrectly.
What Good Looks Like: Mature GEO programs influence 20-35% of total pipeline even though last-click attribution might show only 5-10%. This gap reveals massive value traditional measurement misses entirely.
How We Track It: Sales process questions identifying AI discovery, multi-touch attribution modeling crediting AI citations appropriately, and cohort analysis comparing close rates between AI-discovered versus other-channel prospects.
Business Connection: Pipeline influenced by AI citations typically shows 15-25% higher average deal sizes because prospects research more thoroughly before engaging, understanding your full solution value rather than comparing only on price.
Metric 8: Conversion Rate Advantage (AI-Sourced vs. Traditional)
What It Measures: How AI-attributed leads convert compared to traditional organic search, paid advertising, and other marketing channels. This metric proves quality advantages that justify GEO investment despite potentially lower absolute volume.
Why It Matters: GEO generates fewer total leads than some channels but dramatically higher conversion rates. Understanding this quality premium helps justify investment even when lead volume seems modest initially.
What Good Looks Like: AI-sourced leads convert at 2.3-4.4x the rate of traditional organic leads across industries. B2B companies typically see 14-18% AI lead conversion versus 3-5% traditional organic conversion.
How We Track It: Segmented conversion analysis comparing AI-attributed leads against all other sources with funnel stage progression rates, sales cycle length, and close rate differences documented monthly.
Business Connection: Higher conversion rates mean fewer leads required to hit revenue targets. Marketing teams generating 100 AI-sourced leads monthly often produce more pipeline than 500 traditional leads because of dramatic quality advantages.
Metric 9: Citation Source Diversity
What It Measures: Which of your web pages, content types, and domains AI platforms cite when mentioning your brand. This reveals whether citations concentrate on specific assets or distribute across your content portfolio.
Why It Matters: Diverse citation sources indicate comprehensive topical authority. AI platforms citing only your homepage or a single blog post suggest limited expertise recognition, while citations spanning multiple resources signal deeper authority.
What Good Looks Like: Healthy citation portfolios include 10-20 different source pages across blogs, case studies, comparison content, and authoritative guides. Market leaders see 30+ unique pages cited across various AI platforms.
How We Track It: Citation source analysis documenting which URLs AI platforms reference, content type distribution (blog vs. guide vs. case study), and changes as new content launches and older assets refresh.
Business Connection: Broader citation source diversity correlates with 25-35% higher visibility scores because AI platforms trust brands with comprehensive content demonstrating expertise across topic breadth rather than narrow specialization.
Metric 10: Zero-Click Brand Impressions
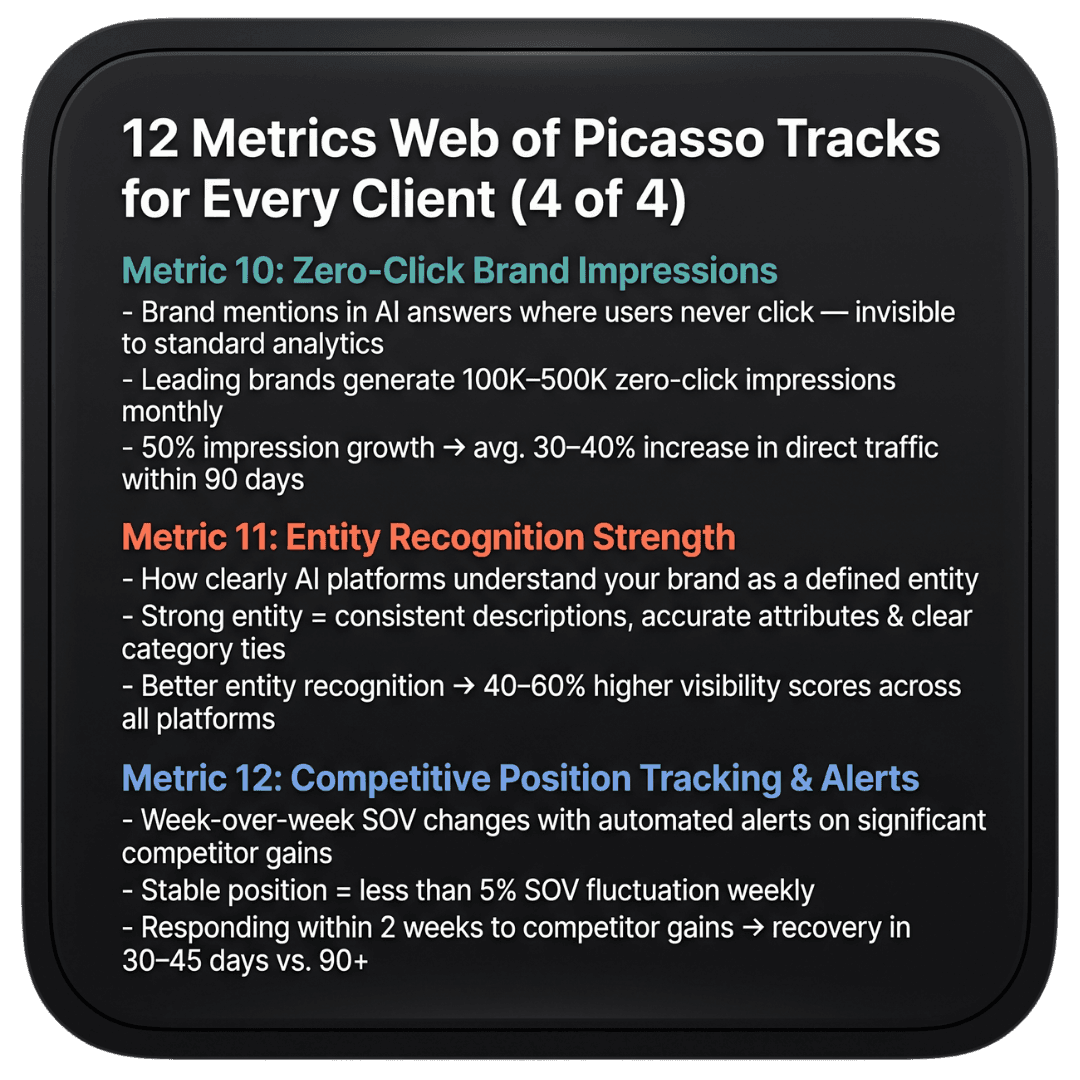
What It Measures: How many times prospects see your brand mentioned in AI-generated answers without clicking through to your website. Traditional analytics miss these completely despite massive awareness value.
Why It Matters: Research shows 60%+ of AI interactions end without clicks, yet these zero-click exposures build awareness and authority that influence later purchase decisions traditional measurement never attributes correctly.
What Good Looks Like: Leading brands generate 100,000-500,000 monthly zero-click impressions across AI platforms. These impressions create awareness at scale that traditional advertising would cost millions to replicate.
How We Track It: Estimated impression calculation based on query volume data, citation frequency, and AI platform usage statistics. Conservative methodology provides directional understanding of awareness impact traditional tools can't measure.
Business Connection: Zero-click awareness manifests as direct traffic growth and branded search increases. Web of Picasso clients growing zero-click impressions 50% report average 30-40% increases in direct traffic within 90 days.
Metric 11: Entity Recognition Strength
What It Measures: How clearly AI platforms understand your brand as a distinct entity with defined attributes, relationships, and category positioning. Strong entity recognition enables better citations across diverse query types.
Why It Matters: AI platforms cite brands they recognize as authoritative entities more frequently and with better context than those lacking clear entity definitions. Entity recognition determines citation eligibility before optimization even begins.
What Good Looks Like: Well-defined entities show consistent brand descriptions across platforms, clear category associations, accurate attribute recognition (founded date, headquarters, specialties), and proper relationship mapping to related concepts.
How We Track It: Entity query testing asking AI platforms about your brand directly, analyzing response accuracy and consistency, documenting attribute recognition, and comparing against competitor entity definitions.
Business Connection: Stronger entity recognition correlates with 40-60% higher visibility scores because AI platforms confidently cite brands they clearly understand versus hesitating on ambiguous entities where relationships and attributes remain unclear.
Metric 12: Competitive Position Tracking & Alert System
What It Measures: Week-over-week changes in competitive share of voice with automated alerting when competitors gain significant citation share requiring strategic response.
Why It Matters: Generative engine citations shift rapidly as competitors launch optimizations and AI platforms update training data. Weekly monitoring enables proactive response before losing significant market share.
What Good Looks Like: Stable competitive positions show less than 5% share of voice fluctuation week-over-week. Significant competitor gains triggering 10%+ share shifts require immediate investigation and tactical response.
How We Track It: Automated weekly competitive analysis with email/SMS alerts when competitor citation share increases beyond threshold. Dashboard shows 12-week trend analysis revealing whether losses are temporary fluctuations or sustained threats.
Business Connection: Early competitive threat detection enables rapid response preventing pipeline loss. Clients responding within two weeks to competitive gains typically recover lost share within 30-45 days versus 90+ days for delayed reactions.
How These Metrics Connect to Real Business Outcomes
The power of this measurement framework lies in connecting visibility metrics through quality indicators to actual business results. This linkage proves ROI and justifies continued investment when executives question GEO value.
The Visibility → Quality → Impact Progression
Improvements in foundational visibility metrics (citation frequency, share of voice) lead to quality enhancements (better context, higher sentiment), which drive business impact (more leads, higher conversion rates, increased revenue).
This causal chain means early-stage programs focus on building visibility while mature implementations optimize quality and conversion. Trying to optimize conversion before establishing baseline visibility wastes resources on small sample sizes that can't produce statistical significance.
Executive Dashboard: What Leadership Actually Sees
Web of Picasso provides executive stakeholders with simplified dashboards highlighting the metrics CEOs and CFOs care about: pipeline contribution, revenue attribution, conversion rate advantage, and competitive position.
Technical metrics like entity recognition and citation source diversity remain in operational dashboards where they inform tactical optimization but don't burden executives with detail that doesn't directly connect to business outcomes.
The Technology Stack Enabling Comprehensive Measurement
Tracking these 12 metrics requires sophisticated technology combining API integrations, manual research, proprietary algorithms, and third-party platforms that most agencies don't possess.
Proprietary Tracking Infrastructure
Web of Picasso built custom tracking systems querying AI platforms 10,000+ times monthly across 500+ client-specific prompts. This infrastructure provides citation frequency data, competitive analysis, and quality scoring that off-the-shelf tools don't offer.
Our technology integrates with client analytics platforms, CRM systems, and marketing automation to connect visibility metrics through to closed revenue with multi-touch attribution modeling that captures true GEO contribution.
Manual Quality Analysis
While technology provides quantitative measurement, understanding citation quality, context, and sentiment requires human analysis. Our team manually reviews 100+ citations monthly per client, providing qualitative insights that algorithms miss.
This combination of automated quantitative tracking plus manual qualitative analysis creates comprehensive measurement capturing both what's happening and why it matters for business outcomes.
Common Measurement Mistakes Agencies Make
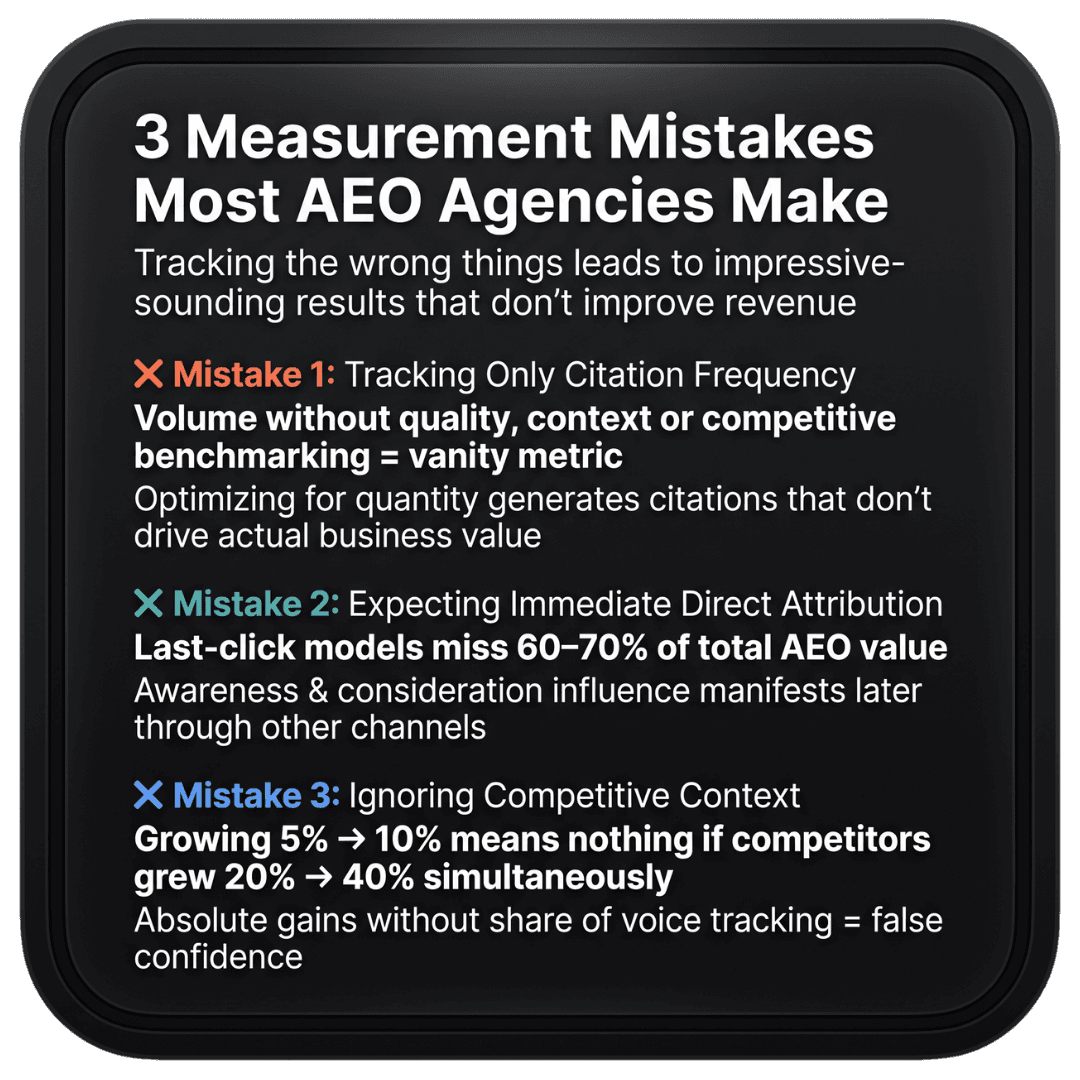
Most agencies attempting GEO measurement make predictable errors that lead to wrong conclusions and wasted optimization resources.
Mistake 1: Tracking Only Citation Frequency
Many agencies celebrate growing citation volume without assessing quality, business impact, or competitive context. This leads to optimizing for quantity over quality, generating citations that don't actually drive business value.
Web of Picasso's framework ensures visibility growth connects through quality metrics to business outcomes, preventing the common trap of impressive-sounding results that don't improve client revenue.
Mistake 2: Expecting Immediate Attribution
Agencies trying to prove direct attribution between every citation and closed revenue miss the awareness and consideration influence that manifests as better-qualified prospects arriving through other channels later.
Our multi-touch attribution modeling captures this indirect influence that represents 60-70% of total GEO value but traditional last-click measurement completely misses.
Mistake 3: Ignoring Competitive Context
Absolute citation improvements mean little without competitive benchmarking. Growing from 5% to 10% visibility sounds impressive until discovering competitors grew from 20% to 40%, doubling their advantage while you celebrated modest gains.
Web of Picasso's share of voice tracking ensures clients understand relative performance determining whether they're winning or losing competitive battles for AI-driven discovery.
How Web of Picasso Delivers Comprehensive Measurement
At Web of Picasso, measurement infrastructure is included in every client engagement rather than treating it as optional add-on. We believe proving ROI is as important as delivering results because measurement enables securing expanded budgets that accelerate success.
Real-Time Client Dashboards
Every client receives 24/7 access to dashboards showing all 12 metrics with weekly updates and monthly strategic reviews. This transparency ensures clients always know exactly what they're getting for their investment.
Dashboards include executive summaries for C-level stakeholders, operational detail for marketing teams, and technical analysis for content and SEO practitioners - serving all stakeholder needs without overwhelming anyone with irrelevant detail.
Monthly Strategic Reviews
We conduct monthly business reviews connecting metric improvements to strategic objectives and business outcomes. These sessions identify what's working, what needs adjustment, and where to focus optimization resources for maximum impact.
Strategic reviews include competitive analysis showing how your performance compares to market leaders, opportunity identification highlighting untapped citation potential, and clear recommendations with expected impact if implemented.
Quarterly Executive Presentations
Every quarter, we provide executive presentations summarizing GEO program performance, demonstrating ROI through pipeline and revenue attribution, and recommending strategic adjustments based on market changes and competitive threats.
These presentations use executive language focusing on business outcomes rather than technical tactics, ensuring C-level stakeholders maintain confidence in GEO investment even when they don't understand optimization details.
Getting Started: First Steps to Comprehensive Measurement
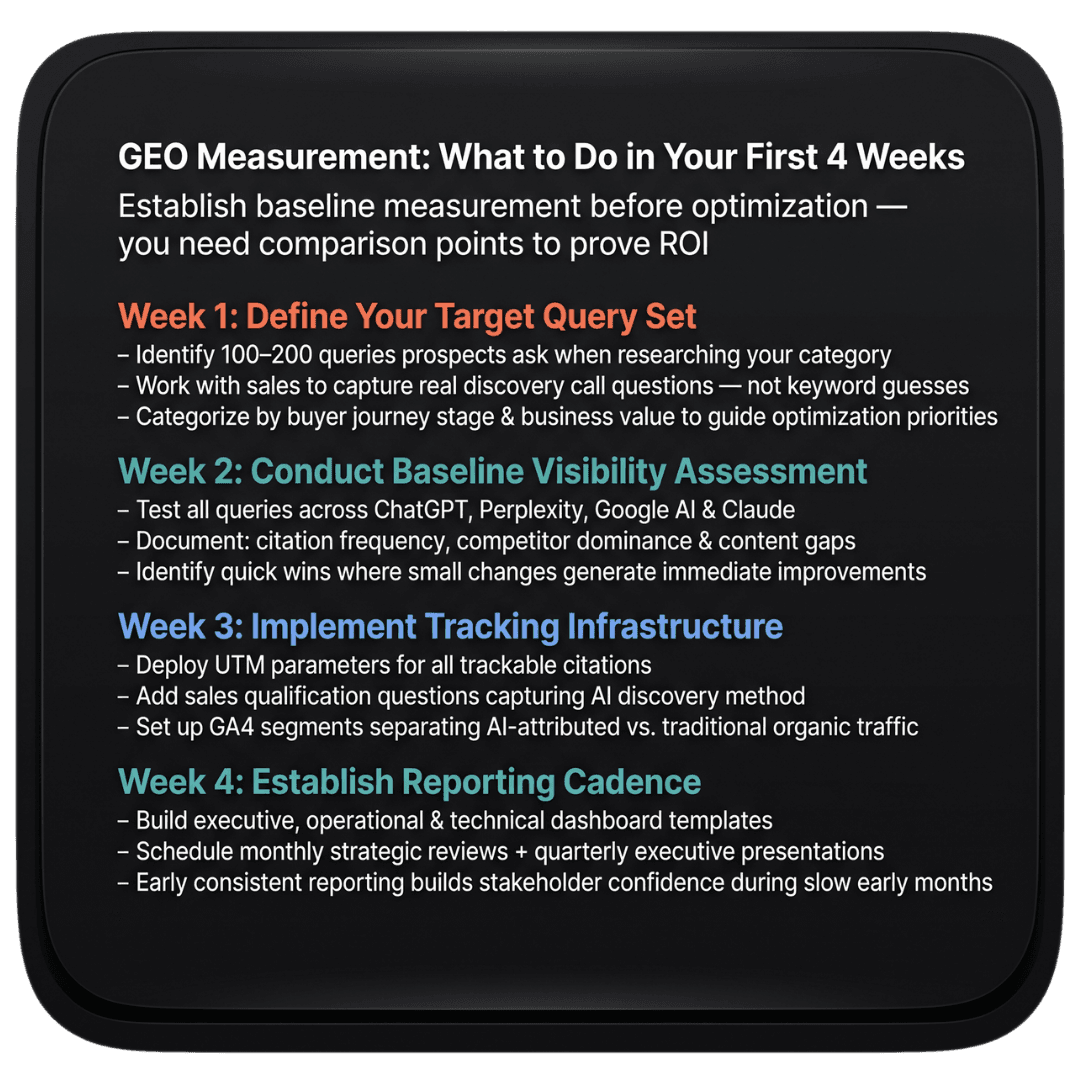
Companies beginning GEO programs should establish baseline measurement before optimization begins. This baseline creates comparison points proving improvement and justifying continued investment as results accumulate.
Week 1: Define Your Target Query Set
Identify 100-200 queries prospects ask when researching solutions in your category. Work with sales teams to understand actual questions asked during discovery calls rather than guessing from keyword research.
Categorize queries by buyer journey stage (awareness, consideration, decision) and expected business value (high-intent decision queries worth more than general awareness questions). This prioritization guides where to focus optimization efforts.
Week 2: Conduct Baseline Visibility Assessment
Test all target queries across ChatGPT, Perplexity, Google AI Overviews, and Claude, documenting current citation frequency. This baseline reveals current visibility before optimization begins.
Document competitors appearing more frequently, content gaps preventing citations, and quick wins where small optimizations could generate immediate improvements. This analysis guides initial tactical priorities.
Week 3: Implement Tracking Infrastructure
Deploy UTM parameters for trackable citations, implement sales qualification questions capturing AI discovery, and establish GA4 segments separating AI-attributed traffic from traditional organic sources.
This tracking infrastructure captures business impact metrics from day one rather than trying to retrofit measurement months later when proving ROI becomes urgent.
Week 4: Establish Reporting Cadence
Create executive, operational, and technical dashboard templates serving different stakeholder needs. Schedule monthly strategic reviews and quarterly executive presentations ensuring consistent communication as program matures.
Early consistent reporting builds stakeholder confidence and secures continued support during the initial months when visibility grows but business impact hasn't yet manifested.
Ready to Measure What Actually Matters?
Web of Picasso provides comprehensive measurement infrastructure tracking all 12 metrics for every client from day one. Our proprietary technology, manual quality analysis, and strategic interpretation connect GEO visibility to business outcomes executives care about.
We don't just optimize for citations - we prove that citation improvements drive pipeline growth, revenue increases, and competitive advantages that justify continued investment at scale.
Schedule a consultation to see our client dashboard, understand our measurement methodology, and learn how we'll prove ROI for your specific situation.
Contact Web of Picasso
Website: Visit Web of Picasso
Email: info@webofpicasso.net
Get Started: Book your free GEO measurement assessment and dashboard demo


